Mitsubishi Montero (1991+). Manual — part 320
the iron core here.
This pintle hump at Point "E" should occur near the end of
the downward slope, and not afterwards. If it does occur after the
slope has ended and the voltage has stabilized, it is because the
pintle is slightly sticking because of a faulty injector
If you see more than one hump it is because of a distorted
pintle or seat. This faulty condition is known as "pintle float".
It is important to realize that it takes a good digital
storage oscilloscope or analog lab scope to see this pintle hump
clearly. Unfortunately, it cannot always be seen.
Fig. 2: Identifying Voltage Controlled Type Injector Pattern
INTERPRETING A CURRENT CONTROLLED PATTERN
NOTE: Current controlled drivers are also known as "Peak and Hold"
drivers. They typically require injector circuits
with a total leg resistance with less than 12 ohm.
NOTE: This example is based on a constant power/switched ground
circuit.
* See Fig. 3 for pattern that the following text describes.
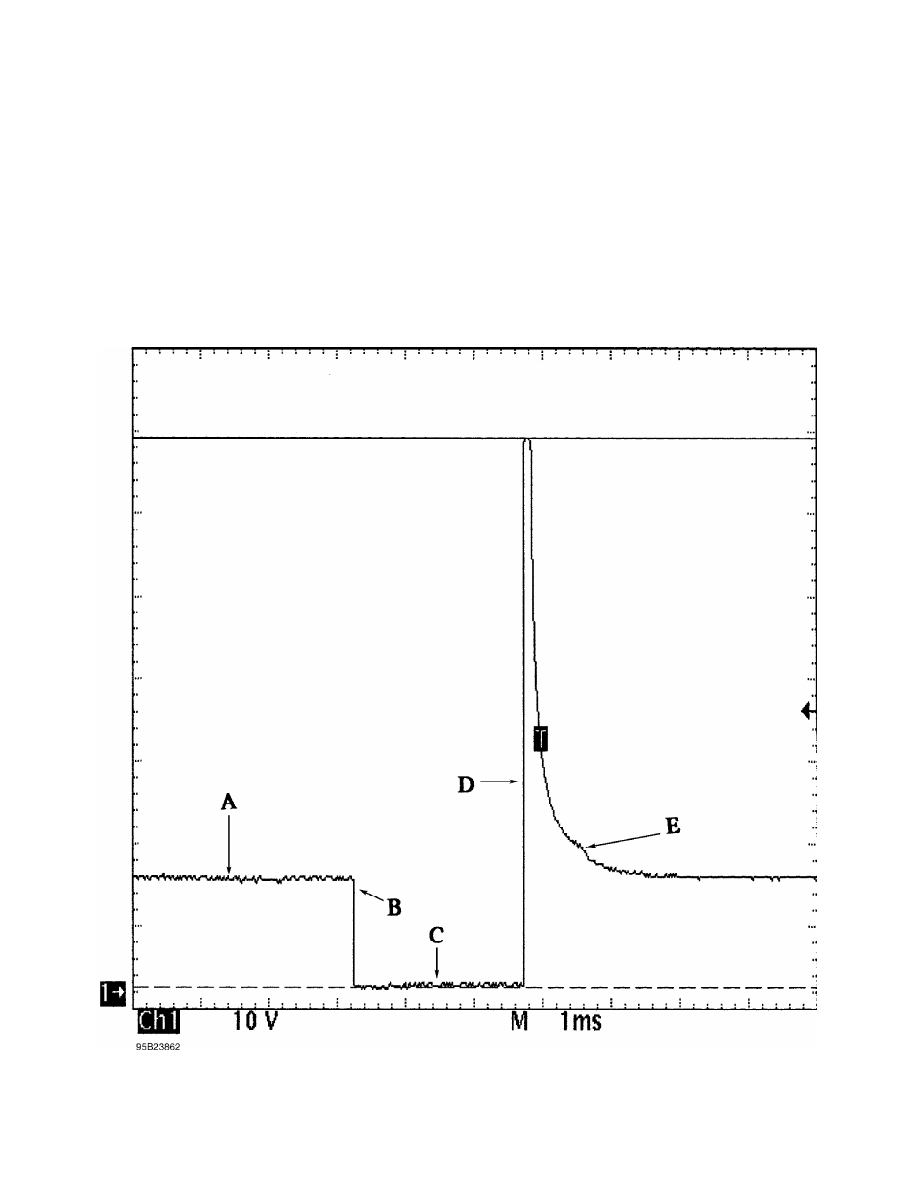
Point "A" is where system voltage is supplied to the
injector. A good hot run voltage is usually 13.5 or more volts. This
point, commonly known as open circuit voltage, is critical because the
injector will not get sufficient current saturation if there is a
voltage shortfall. To obtain a good look at this precise point, you
will need to shift your Lab Scope to five volts per division.
You will find that some systems have slight voltage
fluctuations here. This could occur if the injector feed wire is also
used to power up other cycling components, like the ignition coil(s).
Slight voltage fluctuations are normal and are no reason for concern.
Major voltage fluctuations are a different story, however. Major
voltage shifts on the injector feed line will create injector
performance problems. Look for excessive resistance problems in the
feed circuit if you see big shifts and repair as necessary.
Point "B" is where the driver completes the circuit to
ground. This point of the waveform should be a clean square point
straight down with no rounded edges. It is during this period that
current saturation of the injector windings is taking place and the
driver is heavily stressed. Weak drivers will distort this vertical
line.
Point "C" represents the voltage drop across the injector
windings. Point "C" should come very close to the ground reference
point, but not quite touch. This is because the driver has a small
amount of inherent resistance. Any significant offset from ground is
an indication of a resistance problem on the ground circuit that needs
repaired. You might miss this fault if you do not use the negative
battery post for your Lab Scope hook-up, so it is HIGHLY recommended
that you use the battery as your hook-up.
Right after Point "C", something interesting happens. Notice
the trace starts a normal upward bend. This slight inductive rise is
created by the effects of counter voltage and is normal. This is
because the low circuit resistance allowed a fast build-up of the
magnetic field, which in turn created the counter voltage.
Point "D" is the start of the current limiting, also known as
the "Hold" time. Before this point, the driver had allowed the current
to free-flow ("Peak") just to get the injector pintle open. By the
time point "D" occurs, the injector pintle has already opened and the
computer has just significantly throttled the current back. It does
this by only allowing a few volts through to maintain the minimum
current required to keep the pintle open.
The height of the voltage spike seen at the top of Point "D"
represents the electrical condition of the injector windings. The
height of this voltage spike (inductive kick) is proportional to the
number of windings and the current flow through them. The more current
flow and greater number of windings, the more potential for a greater
inductive kick. The opposite is also true. The less current flow or
fewer windings means less inductive kick. Typically you should see a
minimum 35 volts.
If you see approximately 35 volts, it is because a zener
diode is used with the driver to clamp the voltage. Make sure the
beginning top of the spike is squared off, indicating the zener dumped
the remainder of the spike. If it is not squared, that indicates the
spike is not strong enough to make the zener fully dump, meaning there
is a problem with a weak injector winding.
If a zener diode is not used in the computer, the spike from
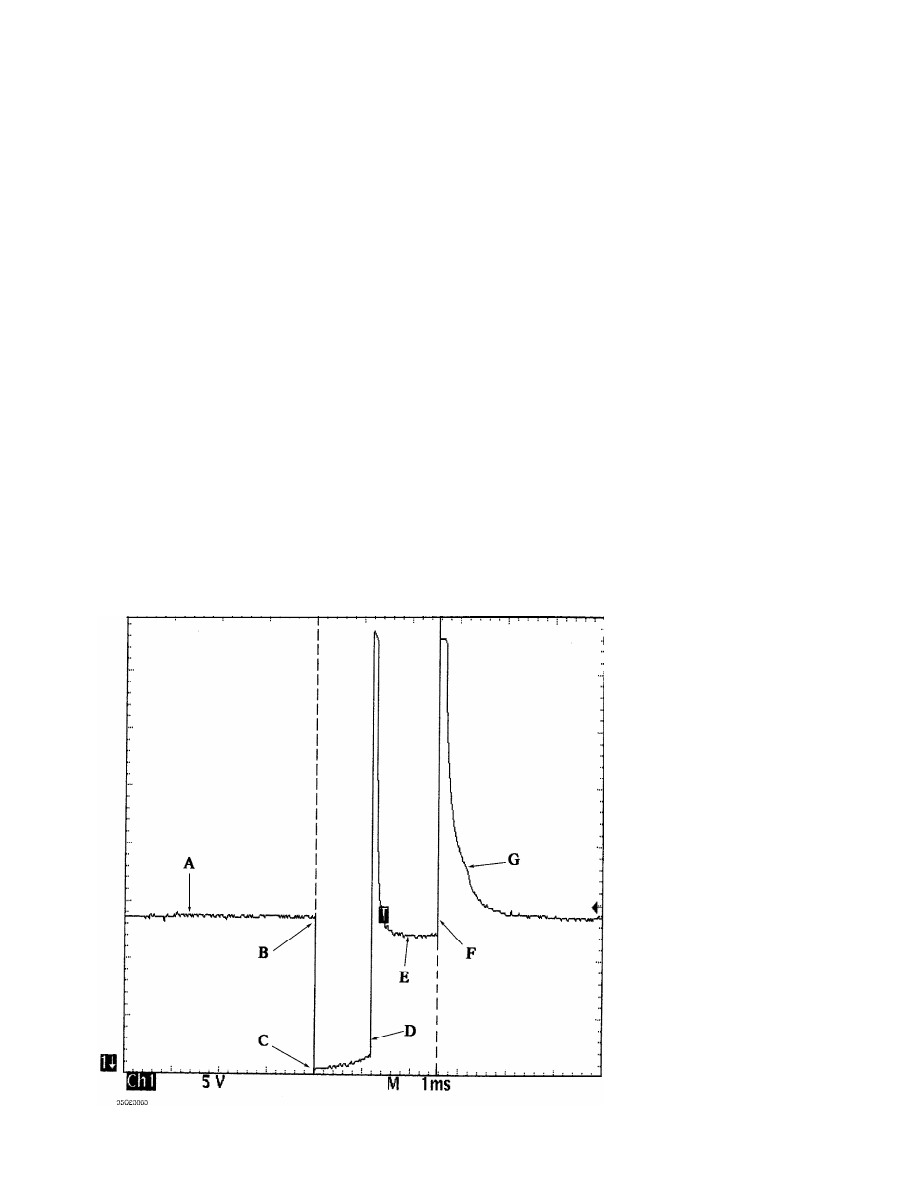
a good injector will be 60 or more volts.
At Point "E", notice that the trace is now just a few volts
below system voltage and the injector is in the current limiting, or
the "Hold" part of the pattern. This line will either remain flat and
stable as shown here, or will cycle up and down rapidly. Both are
normal methods to limit current flow. Any distortion may indicate
shorted windings.
Point "F" is the actual turn-off point of the driver (and
injector). To measure the millisecond on-time of the injector, measure
between points "C" and "F". Note that we used cursors to do it for us;
they are measuring a 2.56 mS on-time.
The top of Point "F" (second inductive kick) is created by
the collapsing magnetic field caused by the final turn-off of the
driver. This spike should be like the spike on top of point "D".
Point "G" shows a slight hump. This is actually the
mechanical injector pintle closing. Recall that moving an iron core
through a magnetic field will create a voltage surge. The pintle is
the iron core here.
This pintle hump at Point "E" should occur near the end of
the downward slope, and not afterwards. If it does occur after the
slope has ended and the voltage has stabilized, it is because the
pintle is slightly sticking. Some older Nissan TBI systems suffered
from this.
If you see more than one hump it is because of a distorted
pintle or seat. This faulty condition is known as "pintle float".
It is important to realize that it takes a good digital
storage oscilloscope or analog lab scope to see this pintle hump
clearly. Unfortunately, it cannot always be seen.
Fig. 3: Identifying Current Controlled Type Injector Pattern
CURRENT WAVEFORM SAMPLES
EXAMPLE #1 - VOLTAGE CONTROLLED DRIVER
The waveform pattern shown in Fig. 4 indicate a normal
current waveform from a Ford 3.0L V6 VIN [U] engine. This voltage
controlled type circuit pulses the injectors in groups of three
injectors. Injectors No. 1, 3, and 5 are pulsed together and cylinders
2, 4, and 6 are pulsed together. The specification for an acceptable
bank resistance is 4.4 ohms. Using Ohm’s Law and assuming a hot run
voltage of 14 volts, we determine that the bank would draw a current
of 3.2 amps.
However this is not the case because as the injector windings
become saturated, counter voltage is created which impedes the current
flow. This, coupled with the inherent resistance of the driver’s
transistor, impedes the current flow even more. So, what is a known
good value for a dynamic current draw on a voltage controlled bank of
injectors? The waveform pattern shown below indicates a good parallel
injector current flow of 2 amps. See Fig. 4.
Note that if just one injector has a resistance problem and
partially shorts, the entire parallel bank that it belongs to will
draw more current. This can damage the injector driver.
The waveform pattern in Fig. 5 indicates this type of problem
with too much current flow. This is on other bank of injectors of the
same vehicle; the even side. Notice the Lab Scope is set on a one amp
per division scale. As you can see, the current is at an unacceptable
2.5 amps.
It is easy to find out which individual injector is at fault.
All you need to do is inductively clamp onto each individual injector
and compare them. To obtain a known-good value to compare against, we
used the good bank to capture the waveform in Fig. 6. Notice that it
limits current flow to 750 milliamps.
The waveform shown in Fig. 7 illustrates the problem injector
we found. This waveform indicates an unacceptable current draw of just
over one amp as compared to the 750 milliamp draw of the known-good
injector. A subsequent check with a DVOM found 8.2 ohms, which is
under the 12 ohm specification.
Fig. 4: Injector Bank w/Normal Current Flow - Current Pattern
Нет комментариевНе стесняйтесь поделиться с нами вашим ценным мнением.
Текст