Toyota Prius (2022 year). Manual in english — page 8

129
2
Instru
◆
Hybrid System Indicator
The display changes according to accelerator pedal operation and
displays the current driving status and energy regeneration status.
The Hybrid System Indicator can be displayed on the sub-screen of the
main display (
P. 122) and the head-up display (if equipped)
(
■
How to read the display
Charge area
Shows that energy is being recovered via the regenerative charging.
Eco area
Shows that the vehicle is being driven in an Eco-friendly manner.
Power area
Shows that an Eco-friendly driving range is being exceeded (during full
power driving etc.)
Hybrid Eco area
*
1
Shows that gasoline engine power is not being used very often.
The gasoline engine will automatically stop and restart under various
conditions.
Head-up display
(if equipped)
Sub-screen
Multi-information
display
1
2
3
4

130
EV indicator
*
2, 3
The EV indicator comes on when the vehicle is driven using only the
electric motor (traction motor) or the gasoline engine is stopped.
Hybrid battery (traction battery) status
Eco score
●
By keeping the indicator within Eco area, more Eco-friendly driv-
ing can be achieved.
●
Charge area indicates regeneration
*
4
status. Regenerated
energy will be used to charge the hybrid battery (traction battery).
*
1
: Not displayed on the sub-screen.
*
2
: Not displayed on the sub-screen or head-up display.
*
3
: The EV indicator function can be turned off in the “Meter Customize”
settings. (
*
4
: When used in this manual, “regeneration” refers to the conversion of
energy created by the movement of the vehicle into electrical energy.
■
“ECO Accelerator Guidance”
A blue zone is displayed in the
Eco area which can be used as
a reference operation range for
using the accelerator pedal
according to driving conditions
such as starting off and cruis-
ing.
The “ECO Accelerator Guid-
ance” display changes accord-
ing to the driving status, such as
when starting off or cruising.
It is easier to drive in an Eco-friendly manner by driving according to the
display showing the accelerator pedal operations and staying within the
“ECO Accelerator Guidance” range. (
The “ECO Accelerator Guidance” function can be turned off in the
“Meter Customize” settings. (
5
6
7
“ECO Accelerator Guidance”

131
2
Instru
■
Eco score
The driving status for the following 3 situations are evaluated in 5
levels: Smooth start-off acceleration (“Eco-Start”), driving without
sudden acceleration (“Eco-Cruise”) and smooth stopping (“Eco-
Stop”). Each time the vehicle is stopped, a score result is displayed
out of a perfect score of 100 points.
Score result
“Eco-Start” status
“Eco-Cruise” status
“Eco-Stop” status
How to read the bar display:
*
: For items not currently evaluated, the display reads 0.
●
The Eco score is reset each time the vehicle starts off to start a new
evaluation.
●
When the shift position is P, only the Eco score display area is
enlarged and displayed. When the shift position is shifted from P,
the display returns to normal.
●
When the hybrid system stops, the current total score result and
advice on how to increase the score are displayed. (
1
2
3
4
Score
Low
*
High
Bar display
132
■
When operation of each function stops
●
The Hybrid System Indicator stops operating in the following situations.
• The “READY” indicator is not illuminated.
• The shift position is not D or B.
●
The Eco score and “ECO Accelerator Guidance” stop operating in the fol-
lowing situations.
• The Hybrid System Indicator is not operating.
• Cruise control (if equipped) or dynamic radar cruise control with full-
speed range (if equipped) is being used.
■
About the Eco score
●
After starting off, Eco score display does not start until the vehicle speed
exceeds approximately 19 mph (30 km/h).
●
In addition to the vehicle driving status, the Eco score also evaluates the air
conditioning system usage condition (
P. 148). The score displayed when
the hybrid system stops is the total result of the driving status after the
hybrid system starts and the air conditioning usage condition.

133
2
Instru
◆
“Fuel Consumption Record”
The transitions of the average fuel consumption after the hybrid
system starts can be checked in such a unit as every 5 minutes or
every 1 mile (1.6 km)
*
1
or 1 km (0.6 mile)
*
2
of driving. Also, it is
possible to check the average fuel consumption history for each
month by switching to the “Monthly” display.
*
1
: When the unit is set to “MPH”
*
2
: When the unit is set to “km/h”
■
How to read the screen
The “5 min” display is shown as an example. However, the basic
method for how to read the screen is the same for each fuel con-
sumption history screen.
Current average fuel con-
sumption record (yellow dis-
play)
*
1
When the recorded unit is
exceeded (every 5 min., every
1 mile [1.6 km]
*
2
or 1 km
[0.6 mile]
*
3
, etc.) the currently
displayed
history
moves
towards the left side and the old-
est record is deleted.
Past average fuel consumption record (green display)
Tab display
Displays types of “Fuel Consumption Record”.
*
1
: When displayed by “Monthly”, the average fuel consumption for the cur-
rent month is displayed.
*
2
: When the unit is set to “MPH”
*
3
: When the unit is set to “km/h”
1
2
3

134
■
Types of “Fuel Consumption Record”
When the unit is set to “MPH”
*
1
: This record is reset each time the hybrid system stops.
*
2
: The maximum value of the graph can be switched in 3 levels (150 MPG,
100 MPG and 50 MPG) by operating the
or
of the meter control
switches while the “Monthly” tab display is selected.
*
3
: The “Monthly” record can be reset on the “Meter Customize” settings
screen. (
Tab display
Recorded contents
Recorded range
“5 min”
Average fuel consumption
of every 5 minutes
*
1
The past 30 minutes
“1 miles”
Average fuel consumption
of every 1 mile (1.6 km)
driven
*
1
The last 15 miles (24.1 km)
driven
“5 miles”
Average fuel consumption
of every 5 miles (8 km)
driven
*
1
The last 30 miles (48.3 km)
driven
“Monthly”
Average fuel consumption
of this month
*
2, 3
Record of last 4 months and
the same month of the pre-
vious year

135
2
Instru
When the unit is set to “km/h”
*
1
: This record is reset each time the hybrid system stops.
*
2
: The maximum value of the graph can be switched in 3 levels (10 L/100 km,
6 L/100 km and 3 L/100 km) by operating the
or
of the meter con-
trol switches while the “Monthly” tab display is selected.
*
3
: The “Monthly” record can be reset on the “Meter Customize” settings
screen. (
Tab display
Recorded contents
Recorded range
“5 min”
Average fuel consumption
of every 5 minutes
*
1
The past 30 minutes
“1 km”
Average fuel consumption
of every 1 km (0.6 mile)
driven
*
1
The last 15 km (9.3 miles)
driven
“5 km”
Average fuel consumption
of every 5 km (3.1 miles)
driven
*
1
The last 30 km (18.6 miles)
driven
“Monthly”
Average fuel consumption
of this month
*
2, 3
Record of last 4 months and
the same month of the pre-
vious year

136
■
Switching the fuel consumption history screen
While the “Fuel Consumption Record” screen is displayed, press
.
The tab display is selected and it is possible to switch the contents of
the display.
Press
or
of the meter control switches to switch the con-
tents of the display.
Each time
is pressed, the display switches in the following order:
When the unit is set to “MPH”
“5 min”, “1 miles”, “5 miles” and “Monthly”
*
. When
is pressed, it
switches in the reverse order.
When the unit is set to “km/h”
“5 min”, “1 km”, “5 km” and “Monthly”
*
. When
is pressed, it switches
in the reverse order.
*
: After “Monthly”, the display returns to “5 min”.
■
Calendar settings
1
2
137
2
Instru
◆
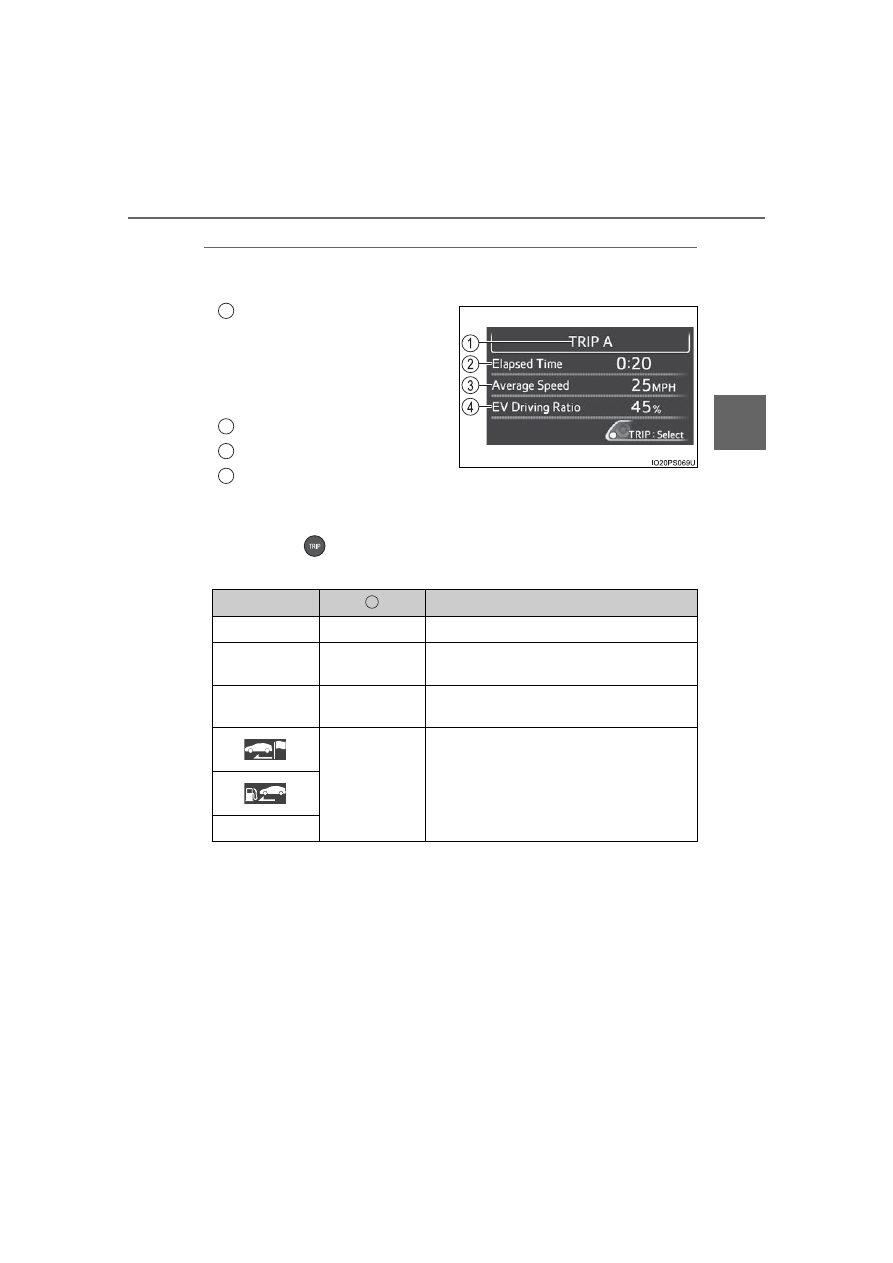
“Drive Monitor”
Displays information such as the driving time and average vehicle
speed, which are linked with the current mileage display. (
Current contents of the dis-
play
Displayed information shows
which driving record the cur-
rently displayed contents are
based on.
“Elapsed Time”
“Average Speed”
“EV Driving Ratio”
For the displayed distance of the mileage display, the percent traveled
using only electric motor power is displayed.
Each time
is pressed, the mileage display (
P. 119) switches
and the contents of the “Drive monitor” change as follows.
*
1
: When the average fuel consumption is reset (
P. 120), the “Drive monitor”
display is also reset.
*
2
: When the trip meter is reset (
P. 120), the “Drive monitor” display is also
reset.
*
3
: This item is reset each time the hybrid system starts.
1
2
3
4
Mileage display
Contents of the “Drive monitor”
ODO
After Reset
Information since last reset
*
1
TRIP A
TRIP A
Information based on driving record of
TRIP A
*
2
TRIP B
TRIP B
Information based on driving record of
TRIP B
*
2
After Start
Information since hybrid system was
started
*
3
Blank screen
1
138
◆
“Eco Savings”
“Gasoline Price”
*
1
and “COMP. Consumption” information is regis-
tered in the “Meter Customize” settings (
P. 153), making it possi-
ble to display 2 types of information related to gasoline fuel
consumption.
“SAVINGS”
If information about the vehicle used to compare fuel consumption
(“COMP. Consumption”) is entered, when the fuel consumption of
this vehicle according to the mileage of the trip meter
*
2
is greater
than that of the comparison vehicle, an estimation
*
3
of the amount
of the fuel cost savings is displayed.
“FUEL COST”
If information about the vehicle used to compare fuel consumption
(“COMP. Consumption”) is not entered, an estimation
*
3
of the
amount of fuel cost savings is displayed according to the mileage of
the trip meter
*
2
.
*
1
: “Gasoline Price” is information necessary to display the “SAVINGS”
and “FUEL COST” records.
*
2
: The display can be switched from the mileage history to the history by
month. (
*
3
: The displayed amount is only an estimate, and may differ from the
actual amount.
139
2
Instru
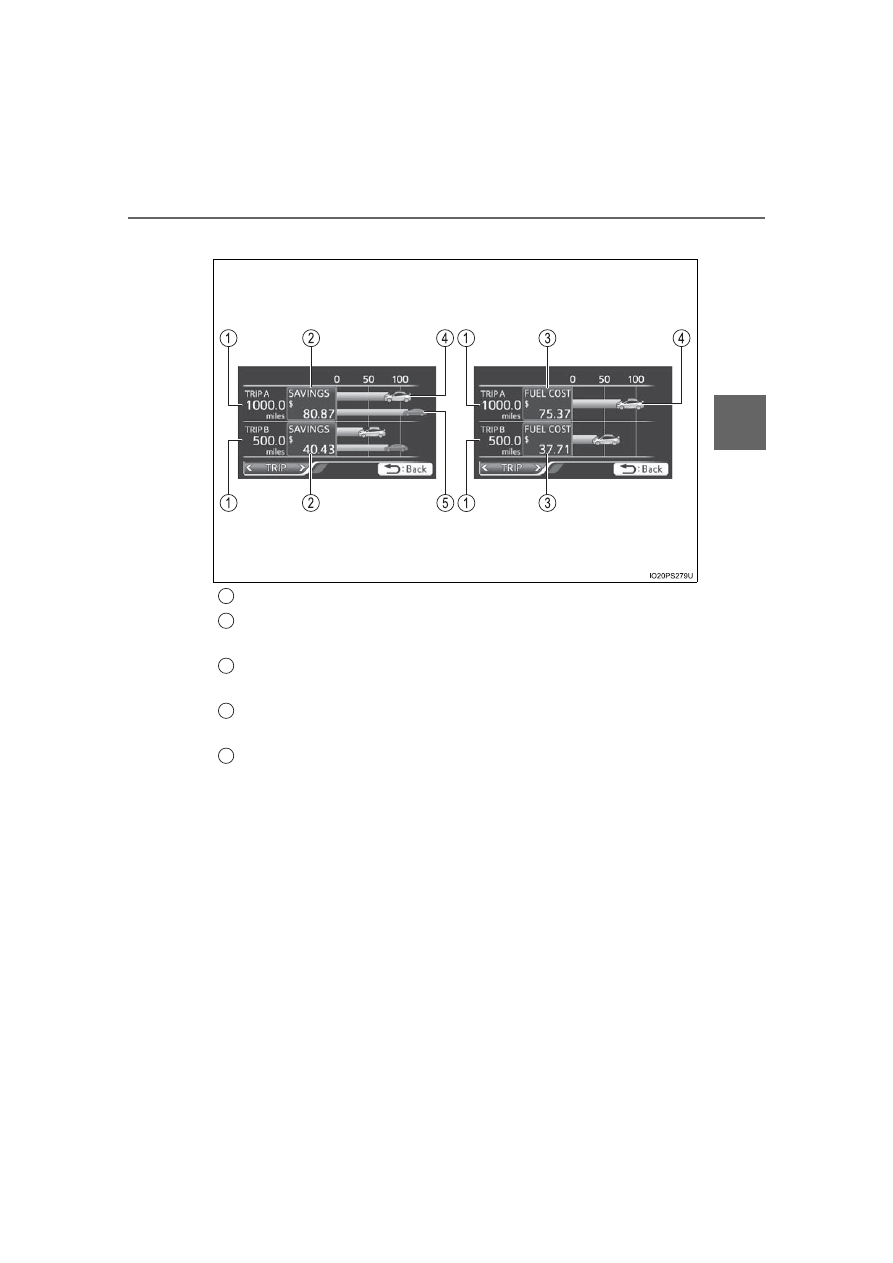
■
How to read the display
Trip meter distance traveled
*
Estimate of fuel consumption saved for displayed distance trav-
eled
*
Estimate of fuel expenses necessary to drive currently displayed
distance
*
Estimate of fuel expenses to drive currently displayed distance
(your vehicle)
*
Estimate of fuel expenses to drive currently displayed distance
(comparison vehicle)
*
*
: When the trip meter is reset (
P. 120), the “Eco Savings” record is also
reset.
“FUEL COST” display
“SAVINGS” display
1
2
3
4
5

140
■
Checking monthly record
The display can be switched to “TRIP” or “Monthly” by pressing
with the tab display selected, and then pressing
or
of the
meter control switches.
Using the “Monthly” display, the
monthly records for “SAVINGS”
and “FUEL COST” can be
checked.
The records for the past 5
months can be displayed by
operating
of the meter con-
trol switches with the “Monthly”
tab display selected.
To reset the “Monthly” contents, perform “History Reset” in the “Meter
Customize” settings (

141
2
Instru
◆
“Eco-Diary”
The distance traveled and average fuel consumption history can be
displayed in a table according to day (“Daily”) or month (“Monthly”)
units.
■
How to read the display
Record of the day/month
Date/month of stored information
Total distance traveled for the day/month
Average fuel consumption of the day/month
Tab display
The display can be switched between “Daily” and “Monthly” by pressing
to enter the select condition, and then operating
or
of the
meter control switches.
“Monthly” display
“Daily” display
1
2
3
4
5

142
■
Checking history
When each screen is selected, past records from the following
ranges can be displayed by pressing
or
of the meter con-
trol switches.
●
If the above number of records is exceeded, the oldest informa-
tion is deleted.
●
To reset the history, perform “History Reset” in the “Meter Cus-
tomize” settings (
P. 153). (“Daily” and “Monthly” information
can be reset independently.)
■
Calendar settings
Displayed screen
Displayed information
Stored information
“Daily”
4 reports
Up to 32 reports
(8 screens)
“Monthly”
Up to 12 reports
(3 screens)

143
2
Instru
◆
AWD display (for AWD vehicles only)
Displays the drive status of each wheel in 6 steps from 0 to 5.
Front-left wheel drive status
Front-right wheel drive status
Rear-left wheel drive status
Rear-right wheel drive status
How to read the drive status display:
■
About drive status display
●
Indicates the drive status of each wheel by the number of bars based on the
driving conditions and AWD system.
●
When the drive power to each wheel is large, the number of bars increases,
and when the drive power is small the number of bars decreases.
●
When the number of bars to the rear wheels is small, the system determines
that stable driving is being performed and the AWD function is suppressed
to increase fuel economy.
1
2
3
4
Drive status
Not being driven
Maximum drive power
Indicators

144
The clock settings can be
changed.
Clock setting display
Item
Setting result
Adjusts the clock.
(
Sets the minutes to
“00”. (
Нет комментариевНе стесняйтесь поделиться с нами вашим ценным мнением.
Текст